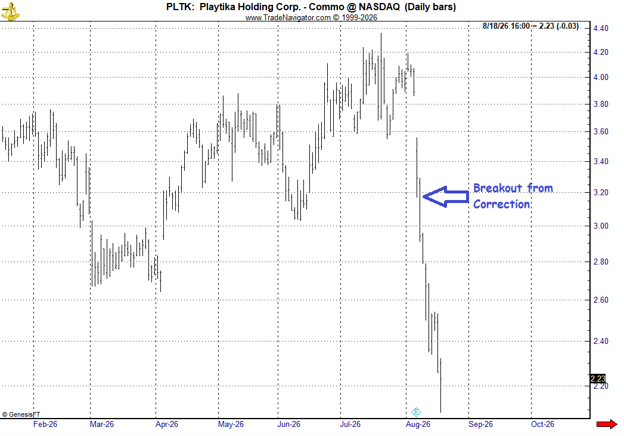
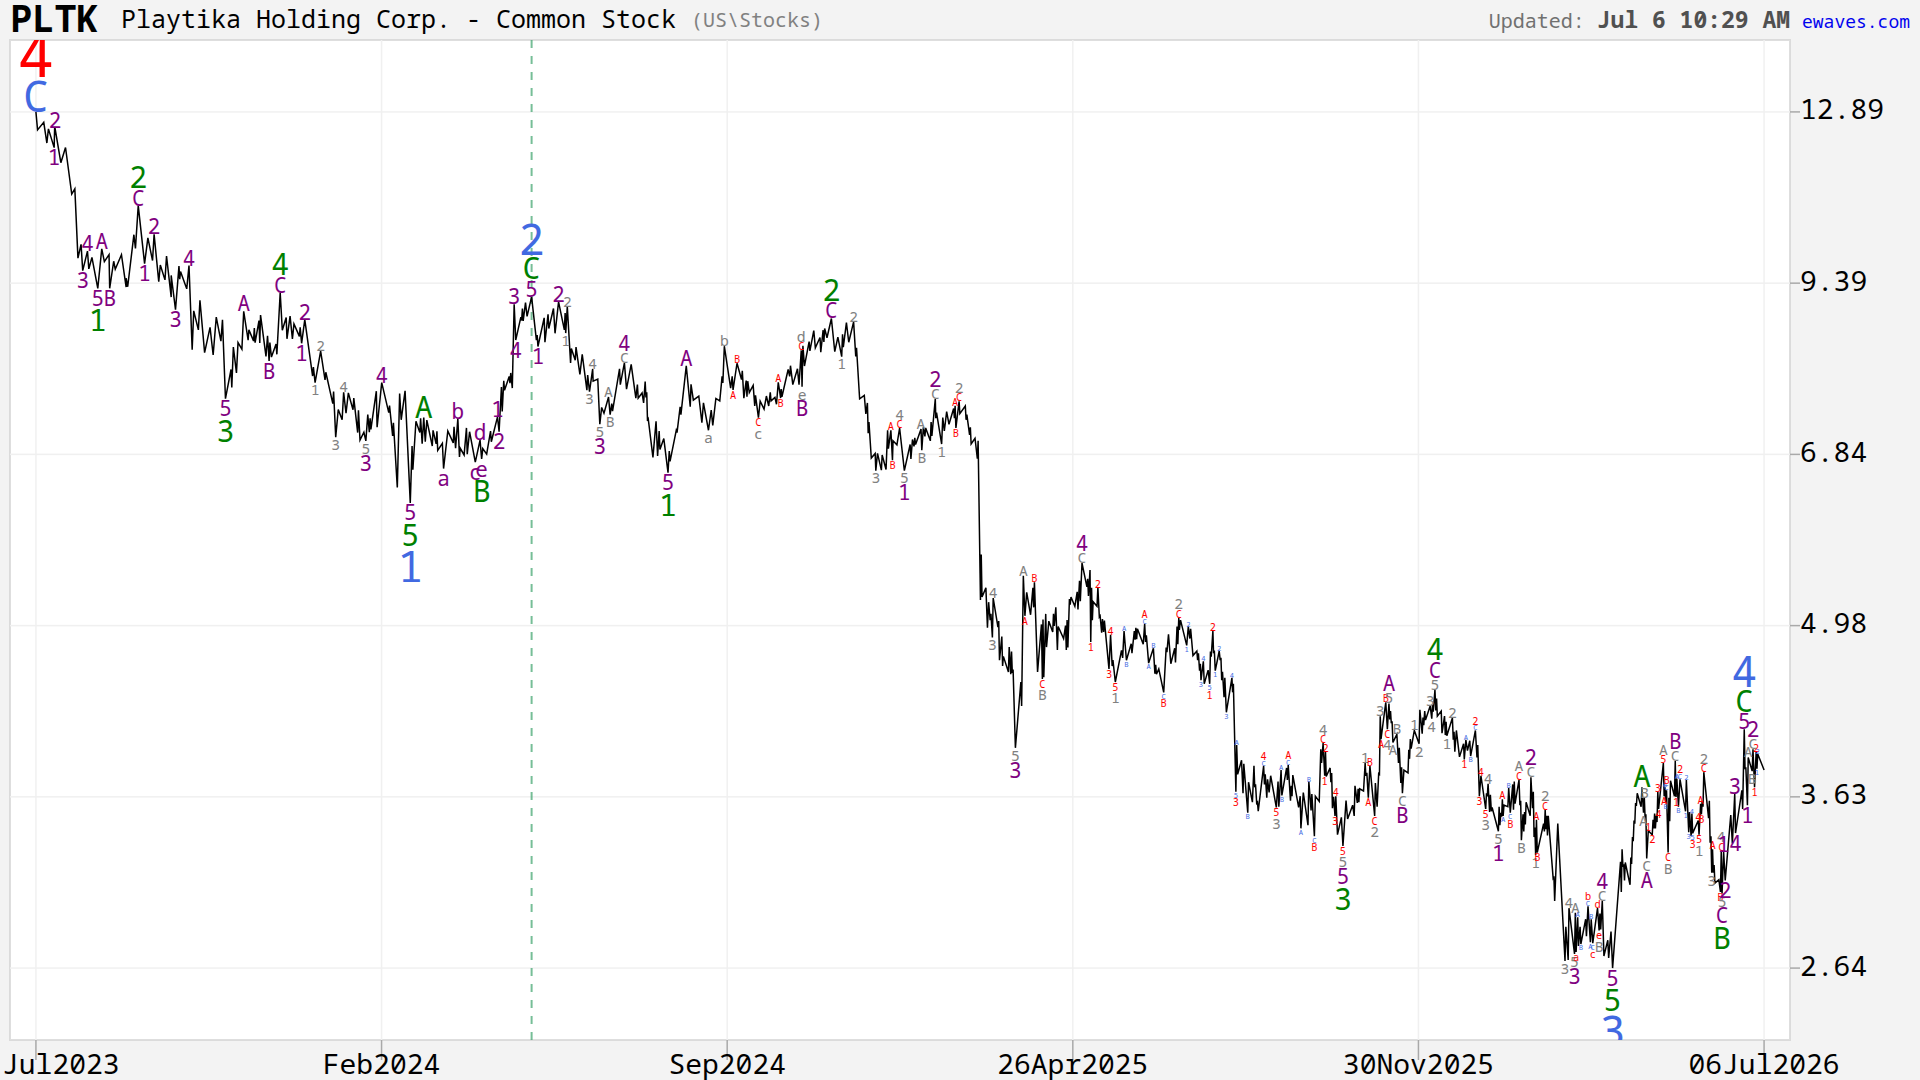
On August 6, the EWAVES Wave Finder identified Playtika Holding Corp. (PLTK) in its “Breakout from Correction” scan. Here’s the wave count that Wave Finder flagged:
What is “Breakout from Correction”?
“Breakout from Correction” is a build-in Wave Finder setup looks for a fresh impulse wave that has just broken the trend channel of the correction before it — but hasn’t yet cleared that correction’s price range and still has room to move.
Here’s why PLTK made the list:
Pattern:
Blue wave 4 had traced out a classic zigzag pattern, labeled green A-B-C, off its April low. On August 6, price broke down out of the corrective channel — the early stages of blue wave 5. At 3.17, with a minimum target below 2.64 and still inside wave 4’s range, there was still room to participate in the move.
Right Look:
Take a minute to study the clear subdivisions on the chart above: the five wave declines within blue waves 1 and 3 – AND the smaller five-wave declines in their purple subwaves. Those are just some of the elements that contribute to the “Elliotticity” score, which measures how closely a market’s structure matches the idealized Elliott wave model. PLTK scored 92%.
Wave Context:
One of the best aspects of the Wave principle in general is the perspective and context it can provide. In this case, four completed waves gave EWAVES a ton of information to project the fifth wave with — channeling, proportion, and dozens of other factors. PLTK has since fallen from 3.17 to 2.16 — a 32% decline as of August 18.