General Questions
What are Elliott waves?
We have an entire page including two videos on that!
What is EWAVES?
EWAVES is the highest quality Elliott wave engine in the world. Many of its analyses look like they were done by a human expert. But as an algorithm, it can analyze an essentially unlimited number of markets.
EWAVES’s secret sauce is that it has been trained on a massive database of carefully vetted, real world historical Elliott wave patterns. It then leverages the statistics derived from these patterns for real-time analysis.
EWAVES ranks markets by elliotticity to determine which have the clearest unfolding patterns. Elliotticity is a statistically significant stylized fact in financial markets, which will be featured in a forthcoming academic paper “Using the Elliott Wave Model to Distinguish Real from Random Financial Returns”.
EWAVES Live is also the world’s first Elliott Wave search engine. Its Wave Finder allows the user to scan across markets for the most reliable Elliott wave trading setups. Users can select from a list of built-in setups, or customize their own setups with flexible queries.
We recommend users have some knowledge of Elliott waves, though deep knowledge is not required because EWAVES does all of the analysis work for you.
Data Questions
When do charts update?
Updates for each region are processed on a 7-day schedule, at the times of day specified in the table below.
When a region is updated, all charts within that region are refreshed simultaneously.
Note: Actual weekend trading only occurs for (1) Crypto and (2) special trading sessions in India.
| Region | Charts Update |
| Australia | 4:30 PM AET |
| China | 15:30 CST |
| Global (CFDs, Crypto, Forex) | 00:00 UTC |
| Hong Kong | 16:30 CST |
| India | 4:00 PM IST |
| Turkey | 6:30 PM TRT |
| UK | 5:00 PM GMT |
| US (Bonds, ETFs, Indices, Stocks) | 10:30 AM | 12:30 PM | 2:30 PM | 4:30 PM ET |
| US (Futures) | 10:30 PM ET |
What markets does EWAVES Live cover?
The various EWAVES Live packages are described here.
Why do I see charts for slightly more or fewer markets than are included in my package?
You may see slightly more markets on occasion. This is because we may decide to include additional markets from time-to-time.
You may see slightly fewer markets on occasion, because some markets in your package may be temporarily excluded for one of two reasons:
- If a particular market has been trading for less than a year, then EWAVES will exclude it. Less than a year is simply far too short a time period for a market to have enough context for meaningful analysis.
- Sometimes a market has not enough discernible fractal structure for EWAVES to attempt to analyze it. For example, if the entire dataset is just a single horizontal line.
Will EWAVES’s market data match what I’m seeing on another platform?
Generally, the data should match that served by our data provider precisely. It may or may not match the data served by a different provider.
There are a couple caveats:
(1) For Stocks/ETFs: EWAVES requires split adjustments on equities/ETFs but disables dividend adjustments. It does so for two reasons. First, total returns do not reflect Elliott waves as well as the direct price action. Second, many data providers model dividends using arithmetic adjustments (rather than multiplicative adjustments), which causes back adjusted prices to go negative. Negative prices cannot be converted to log scale for Elliott wave analysis.
(2) For Futures: Leaving futures data as-is does not work, because there are large gaps between successive contracts as a result of differences in the premium/discount of each contract. Attempting to simulate a continuous contract by using arithmetic offsets (the usual method that data providers use) leads to negative back adjusted prices, losing critical information about the geometric nature of actual cash price returns on the underlying asset (and as a result, are not able to be represented in log scale).
To simulate cash prices, EWAVES employs a custom back-adjustment method for futures that mitigates these issues by linearly interpolating the premium/discount between adjacent contracts, thus simulating actual premium/discount decay. This method ensures: (1) faithful representation of the most recent futures contract, (2) avoidance of sudden price gaps due to rollovers, (3) accurate historical pricing closely mirroring cash prices, and (4) inclusion of intraday extremes often absent from cash price data.
But, it also means that the data will not necessarily match the provider’s own back-adjusted prices. The data for the most recent contract will always match.
Why does EWAVES use line charts instead of bar charts?
Most financial software display bar charts because that’s what people are familiar with. However, bars are inherently ambiguous for wave counting, as they omit crucial information like the sequence in which price extremes occur. This makes it impossible for a computer algorithm to perform wave analysis directly on bar charts.
EWAVES addresses this by converting bars into a series of points before analysis. This removes any ambiguity regarding price ordering and time intervals between prices. EWAVES also uses absolute time, unlike most platforms that use “bar time” (time which ignores non-trading hours). EWAVES’ use of absolute time is visually evident on its charts since it uses long line segments to represent long non-trading periods, such as weekends. As a side benefit, any bits of missing data are automatically replaced with linear interpolation.
Visually speaking, bar charts don’t work well for rendering fractals. Bar charts are not naturally scale invariant like line charts are, and raise many additional questions that are non-issues with line charts: Should bar charts composed of daily bars resemble line charts at large zoom levels, or should we dynamically create larger bars for higher zoom levels? If we don’t dynamically create larger bars, then does that mean daily bars would no longer exist once intraday data exists? Since bars quantize data, does it matter that significant highs and lows would no longer appear precisely where they occurred? How would you smoothly zoom in or out of a bar chart when bar quantization causes prices to randomly jitter their temporal location, and even appear/disappear, as you zoom? Since EWAVES progressively adds more detail to the right-side of the chart vs the left side, would you want smaller bars on one side of the chart vs the other? Where do you horizontally place two wave labels that occur within the same bar?
Bar charts are an anti-feature in the context of wave analysis because they unnecessarily quantize and obscure the underlying data. By using line charts, you know you are seeing the data exactly as EWAVES sees it.
Why isn’t the latest price on the chart the closing price?
EWAVES charts are built using local highs and lows, rather than each bar’s open or close. In Elliott wave analysis, these extremes form the building blocks of larger wave structures.
We have tested including opens and closes, but doing so makes wave counting significantly more difficult because they are arbitrary price points rather than true extremes.
As a result, EWAVES charts do not display closing prices. The latest price shown on the chart represents the most recent detected high or low, not the bar’s closing price.
Analysis Questions
How do I interpret the labels on EWAVES Live charts?
The labels mostly use the convention described in Frost & Prechter’s book Elliott Wave Principle:
- Impulses and diagonals are labeled 1-2-3-4-5
- Zigzags and flats are labeled A-B-C
- Complex corrections are labeled W-X-Y
- Triangles are labeled a-b-c-d-e
Triangles use lowercase letters to avoid ambiguity with flats. Early in a pattern’s formation, triangle waves a and b have the same internal three-wave structure as flat waves A and B, so the case difference makes the pattern type clear even before the full structure has developed. Zigzags are less ambiguous because their A wave subdivides into five waves rather than three.
What does the “0” label mean?
EWAVES must begin its Elliott wave count somewhere on the chart. The large gray 0 label marks this starting point, which we sometimes call the count’s origin.
Most charts have only one origin. In some cases, however, a chart may have a second origin, shown as a red 0. This means EWAVES has restarted the count.
Why would EWAVES sometimes restart the count?
EWAVES analyzes only a finite slice of market history, so the first visible pattern may not represent the beginning of the larger Elliott wave structure. It may instead be the end of a structure that began before the available data.
To handle this, EWAVES allows one optional restart per market. This lets the program complete an initial visible pattern and then begin a new count from that point, which is useful when the visible data cannot be modeled as a single Elliott wave pattern. For example, the chart may begin with a motive or corrective wave immediately before a major turn, followed by a wave that starts a new, much larger motive structure.
The optional restart applies only to the top-level pattern. Smaller-degree waves continue to follow the normal Elliott wave grammar constraints.
Why does EWAVES’ analysis sometimes differ from a particular human analyst’s opinion?
EWAVES’ wave counts will not necessarily align with any particular analyst’s market opinion. Users may review its analysis in isolation or seek to incorporate it with other sources or tools.
Why do some waves not subdivide in an ideal manner?
The reflection of social mood in freely traded markets is imperfect. Therefore, it is generally not possible to label Elliott waves without incorporating some subwaves that do not subdivide cleanly, or that appear to subdivide in ways which do not match their context.
Additionally, all market data formats contain quantization-induced artifacts, making the internal wave structure impossible to discern over short-term intervals. For example, a beautiful five-wave structure on an hourly chart may appear as a three-wave structure when looking at the corresponding daily bars.
To allow EWAVES to count real world data, it is allowed to “squint” over data segments in much the same way that human practitioners do. The resulting waves simply have no internal structure, i.e., they are of an “unknown” type. Their meaning comes from the larger context in which they occur.
How much detail does EWAVES taken into account for analysis?
EWAVES considers a massive amount of analysis detail, but it is not unlimited. It focuses the detail on where it’s most needed. The rule of thumb for this is simple: waves that are closer to the present are analyzed with more detail than waves that are in the distant past.
This design decision was done or two reasons.
First, it shifts more processing time to where it’s most needed.
Second, it is sometimes important to not consider every detail of past waves. Sometimes the market moves in ways where the internal structure of the past is no longer valid, and so placing less emphasis on those little details allows the program to be flexible in a way required for wave analysis. For example, a wave that does not exhibit a clear zigzag structure may be interpreted best as an impulse in real time, but in retrospect may be treated as a zigzag if that is the only valid way to integrate it into a reasonable larger wave count.
Detail is also something that must be carefully considered, because sometimes large details and small details are in conflict: a single wave count may not fully satisfy both large and small detail simultaneously. This is addressed carefully in the EWAVES engine by balancing the elliotticity “weighting” of the internal structure vs the bigger picture. It is quite a complex topic because sometimes you actually want the internal substructure to be “glossed over” in favor of the bigger picture, while other times, you want the opposite behavior. Tuning EWAVES to balance between these two different approaches has been difficult and we have reached a point that is a reasonable compromise between the two.
That said, the highest elliotticity waves and markets will be those where the full picture is clear across both larger and smaller details.
Does EWAVES issue buy and sell signals?
No, EWAVES is not designed as an automated black-box trading system.
EWAVES is intentionally developed as a powerful screening tool that enables discretionary market professionals to quickly identify and rank Elliott wave patterns across thousands of markets. As such, EWAVES incorporates the most reliable Elliott wave trading setups as built-in setups. It also incorporates the ability for the end user to design their own setups.
Given the numerous choices a professional has to leverage EWAVES, results of course will vary from one user to the next.
How does EWAVES change its mind?
EWAVES knows about historical Elliott wave behavior. It doesn’t know specific dates or times, of course. Rather, the aggregate, scale-invariant behavior of historical Elliott wave patterns are encoded into the program as probabilistic tendencies.
Purposefully, however, it has no memory of its own moment-to-moment forecasts. Every new data point causes the program to recalculate the wave count from scratch. This allows EWAVES to “change its mind” on-the-fly.
For markets where the top wave count is much superior to any alternative interpretations, this leads to a stable progression for an Elliott wave.
But, sometimes markets are ambiguous, and therefore there are only small differences between the top count and the top alternative count. When this occurs, the system has a hard time figuring out which is the better count (because they’re both nearly equally good options). This can sometimes result in “flip flopping” behavior between competing interpretations.
The current solution to this is simply to use your own judgement. This is an area of active research for improvement, but at the moment the core issue is intractable. It may be a matter of simply reporting to the user that some markets, at some time frames, have too much ambiguity for a stable forecast.
That said, flip-flopping behavior is preferable to an analyst that “sticks to their guns” on a particular wave count despite an alternative wave count being equally applicable. This is why the issue is so difficult to resolve, and simply not a matter of having EWAVES “stick to its guns” so-to-speak, which is not the correct solution.
How does EWAVES calculate wave targets?
EWAVES estimates the endpoint of an unfolding wave by extrapolating the partial patterns that form its internal structure.
The result is not meant to be an exact price-time point. It should be understood as the center of a target zone. Assuming the current wave count remains valid, the final endpoint is expected to finish below the projected price about half the time and above the projected price about half the time. The same idea applies to the projected time.
Why do smaller-degree wave targets sometimes project further than higher-degree ones?
It can look backwards at first glance, but projections across different wave degrees are not meant to line up in a strict, mechanical way.
The main reason is that these projections are guesses based on extrapolating patterns, and each degree has to be extrapolated using its own pattern. A higher-degree wave is based on extrapolating the broader, longer-term pattern, while a lower-degree wave is influenced more by the nearer-term structure. Since those are not the same thing, they do not always produce targets that agree perfectly in either duration or magnitude. They only become the same thing once the move actually finishes.
So yes, a smaller-degree projection can sometimes extend further in time or price than a larger-degree projection, even though that seems contradictory. In a literal sense, it is a contradiction: both projections cannot ultimately be right exactly as estimated. But that is also why they should be understood as target zones, not hard constraints.
The alternative would be worse: if EWAVES extrapolated the smaller-degree structure upward forever without blending it with the larger-degree behavior, the projections would quickly go off the rails. You would end up with “projections of projections of projections,” where the short-term picture exerts too much influence on the long-term outcome, and the error compounds badly.
So the model has to blend across degrees rather than force a hard agreement between them. That blending can produce situations where the lower-degree wave projects further than the higher-degree wave. It may look odd, but it is a side effect of trying to keep the projections realistic instead of letting the smaller-degree extrapolations dominate everything.
The good news is that the estimates do eventually converge: the closer the market gets to the projected targets, the more they will tend to agree.
Does EWAVES ever break Elliott wave rules?
EWAVES is primarily a constraint solver, so it never violates its rule set. However, that rule set differs slightly from traditional Elliott wave rules in a limited set of specific areas, based on our research into historical wave behavior:
1. Wave 3 cannot be the shortest wave
EWAVES enforces this but allows a small numerical tolerance, since our research has found robust historical examples where wave 3 is the shortest, but only by a slim margin.
2. Wave 4 cannot overlap wave 1
EWAVES enforces this but allows a small tolerance for minor overlap. This accommodates, for example, waves 1 and 4 at the start of the Global Financial Crisis in the DJIA, which exhibit a slight overlap.
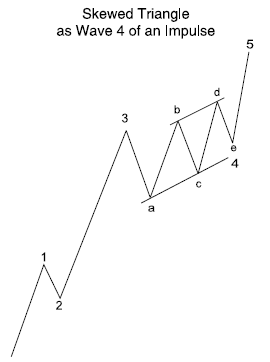
3. Barrier and skewed triangles
Barrier triangles are Elliott wave triangles in which the ends of waves B and D roughly align. In some well-known examples, wave D may slightly exceed the end of wave B. EWAVES not only allows this behavior, it also allows for somewhat more pronounced cases where D clearly exceeds B. Elliott wave analysts have historically called such triangles “skewed triangles.” Our research supports skewed triangles as rare extensions of the standard barrier triangle pattern.
Elliotticity
What is elliotticity?
Elliotticity is the degree to which a data segment adheres to the Elliott wave model. Each individual Elliott wave spans a data segment with an elliotticity rating corresponding to the quality of its internal structure.
Elliotticity values are not percentiles (i.e. a relative rank of wave conformance), but are absolute percentages from 0% to 100% determining how conformant individual waves are to the Elliott wave model. The higher the value, the better.
In theory, Elliotticity could be as high as 100%, but that is only practically possible when using data that is artificially constructed to conform to idealized Elliott waves.
Is elliotticity a stylized fact of financial markets?
Elliott Prechter and Sacha Sardo-Infirri, Ph.D have finished research for their paper, “Using The Elliott Wave Model To Distinguish Real From Random Financial Returns.” In it, they show that EWAVES can tell the difference between real market prices and randomized versions across major markets and indexes like DJIA, Nasdaq, Gold, and even Bitcoin.
Using the Elliott Wave Model to Distinguish Real from Random Financial Returns
Elliott A. Prechter; Dr. Alexander V. Sardo-Infirri; Robert R. Prechter, Jr.
Abstract
We apply an expert system designed to identify Elliott wave patterns in financial data to over 400 years of price history across eight major markets. The system produces a metric, elliotticity, which quantifies the conformity of price series to the Elliott wave model.
Using bootstrap methods, we observe statistically significant differences (p-values < 1 × 10⁻⁵) between the elliotticity scores of actual and randomly permuted returns.
Our findings suggest that elliotticity is a stylized fact of financial market price series. This result provides evidence that market pricing exhibits some degree of non-random structure, and that the Elliott wave model appears to capture certain statistical aspects of this structure.
The results establish elliottcity as a new statistically significant stylized fact for financial data series. This is a breakthrough in financial market theory. The fact that financial data follow fractal patterns contradicts the long-held random walk hypothesis.
The following histogram demonstrates the differences in elliotticity between real 1-year chunks and randomized versions thereof (via permutations of fixed-period returns) across all available daily data for the Dow Jones Industrials, Dow Jones Transports, S&P 500, Nasdaq 100, Russell 2000, Spot Gold, the Dollar Index and Bitcoin. All results are out-of-sample by using special out-of-sample builds of EWAVES. Of course, much more detailed and granular results will be present in the paper.
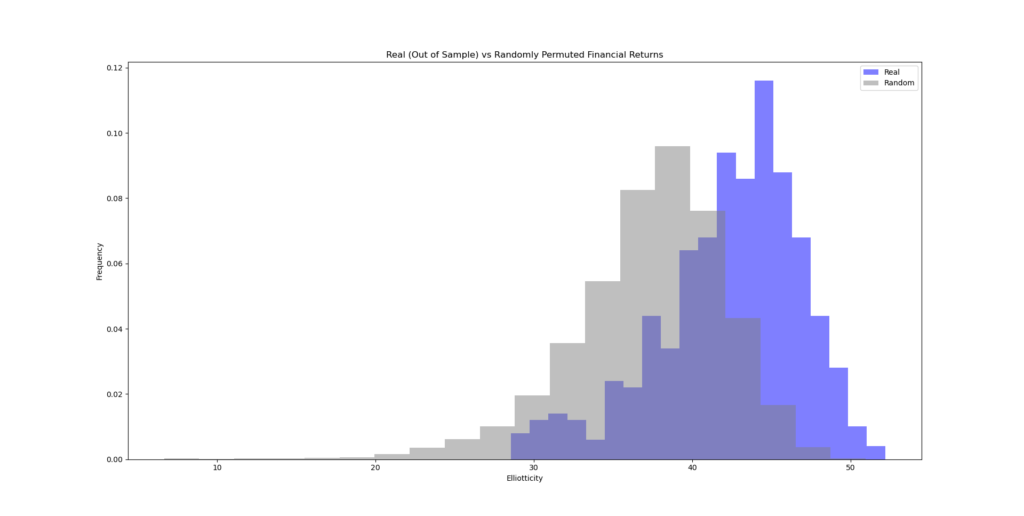
(Click image to expand)
Paper Conclusions
Elliott Wave Analysis Validated: The study demonstrated that real financial returns show patterns that conform significantly more to the Elliott wave model compared to randomly shuffled data. This suggests that the Elliott wave model accurately captures statistical aspects of market behavior.
Statistical Significance: The use of EWAVES revealed statistically significant differences (p < 1 × 10^−5) between actual and randomized financial data, supporting pattern consistency across different market conditions. This confirms that market behavior exhibits identifiable patterns, not randomness.
Stylized Fact of Elliotticity: The results establish elliotticity—conformity to the Elliott wave model—as a characteristic of financial market price series, supporting the model’s validity in capturing market behavior.
Consistency Across Data Segments: The model’s effectiveness was consistent across different historical data segments, with no evidence of “model decay”.
Challenges to Conventional Models:
Against Random Walk Models: This study highlights the model’s ability to capture significant non-random patterns in financial returns, disproving assumptions made by random walk and its derivative models.
Against the Efficient Market Hypothesis: The ability to distinguish real market returns from random data provides compelling evidence against the Efficient Market Hypothesis, indicating that market prices are not fully efficient as EMH would predict.
FROZEN VERSION: The elliotticity values in the paper are from a specific frozen EWAVES (version 3.3), and so the specific elliotticity values produced therein may exhibit a different distribution than the current version which uses newer algorithms.
RAW DATA RESULTS NOW PUBLICLY AVAILABLE VIA GITHUB. Visit https://github.com/elliottp6/rvr to view the raw data, which is referred to in the paper.
— STAY TUNED FOR PAPER PUBLICATION —
Can you provide additional technical information about elliotticity?
A perhaps unexpected aspect of how EWAVES implements elliotticity is that it is scale invariant. The recent daily picture is given as much consideration as the recent weekly picture, which is given as much consideration as the recent monthly picture, and so on. In this way, elliotticity is as equally sensitive to short-term market activity as it is to long-term market activity. In other words, a wave with high elliotticity counts well at all degrees of scale, from the past to the present.
In the past, we have referred to the elliotticity of the largest wave in a market as the market’s total elliotticity. As a result of time frame invariance, total elliotticity is perhaps the most generally useful single numerical value for ranking markets against one another in terms of Elliott wave conformance. If a market has high total elliotticity, then you should be able zoom all the way in, or all the way out, and the market should adhere well to the Elliott wave model at all timescales.
Total elliotticity is the default ranking method used (if sorting markets by elliotticity) when the Wave Finder is inactive. When using the Wave Finder, the elliotticity value will correspond to the wave that you find, which is much more granular and specific. That gives you the option to focus on shorter-term elliotticity rather than total, which can be more useful when the highest-degree waves are unimportant (which is generally the case, since for example you usually do not care about the multi-century picture).
Additionally, to ensure each wave’s elliotticity has a strong meaning, each wave’s elliotticity also includes a modest amount of extra context, i.e. it mixes in some of the elliotticity of other surrounding waves. This makes perfect sense when you consider a wave that has just begun: obviously, the elliotticity of the preceding wave is what you should focus on, because the new wave has virtually no discernible structure yet.
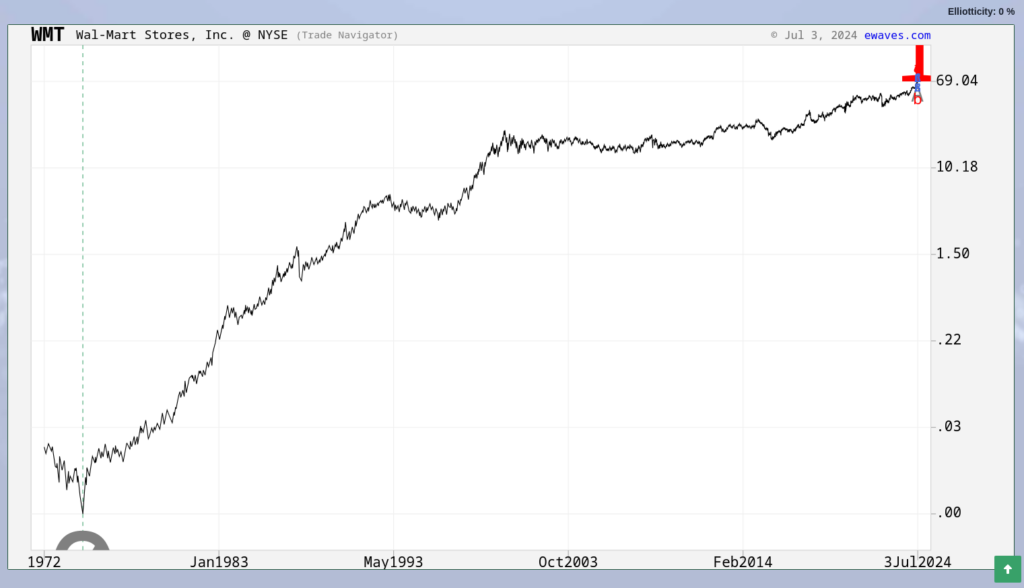
What does it mean when a market has 0% elliotticity?
Sometimes some markets have very low elliotticity, a low as 0% even. This means the market is not adherent enough to the Elliott wave model for a meaningful analysis. In the below example of Walmart stock, it got 0% elliotticity, because the engine was unable to count even a basic impulse or zigzag wave from the low in 1972.
You can see the elliotticity information on the upper-right of the chart when directly jumping to that market via search, or the bottom-right of the chart in browsing mode.
The recommended course of action for low-elliotticity markets is to ignore them, and focus on high elliotticity markets.
Wave Finder
What is the Wave Finder?
EWAVES Live has a built-in Wave Finder, which is the world’s first Elliott wave search engine. It is a query system for quickly finding currently-unfolding Elliott waves based on precise criteria.
There are several built-in setups that you can use directly to find Elliott wave setups, or you can modify these setups to get started on your own custom setups.
What are the Wave Finder Built-in Setups?
We have an entire page dedicated to explaining the built-in setups.
Is there a Wave Finder tutorial?
Yes! Go here to watch the EWAVES Live tutorial video. The video describes how to use EWAVES Live, as well as the Wave Finder query system. The video does not mention the built-in setups however, as that feature was introduced later on.
What are the Context Waves?
There are multiple types of context waves. The context wave called simply “wave” is the actual wave you’re searching for. It is the wave that will be highlighted by the Wave Finder. Many search queries only involve looking for a “wave” with particular attributes (see section “What are the Wave Attributes?” below for details). For example, to find an impulse wave, you would search for a wave with the attribute “type” set to “impulse.”
The other context waves provide the environment (aka “context”) for “wave”. You may, for example, specify attributes for the “prior” context wave. This is the wave structure that precedes the wave you’re searching for. For example, to find waves that follow triangles, you would add the context wave “prior”, and then require that “prior” have the attribute “type” set to “triangle.”
Another context wave is “parent,” which is the larger wave of which “wave” is a component. For example, if you want “wave” to occur in the context of a larger 3rd wave, you would add the context wave “parent” and then require its attribute “label” to be “3.”
The “child” context wave is the last component wave of “wave.” For example, if you were looking for an impulse wave where its 5th wave was in progress, you would add context wave “child” and set its “label” attribute to “5.”
If you wish to specify attributes for a wave larger than “parent”, the grandparent is called “parent(+1)”, the great-grandparent is “parent(+2)”, and so on. Similarly, the grandchild is called is “child(-1)”, the great-grandchild is “child(-2)”, and so on.
Finally, the “subwave” context wave is an advanced feature. It refers to the currently unfolding child wave at that can be any degree lower than “wave” (i.e. it can be child, grandchild, great granchild, etc). This is useful, for example, if you are looking to enter a 3rd wave using 2 of 3, but you actually don’t care if it’s 2 of 3 or if it’s 2 of 1 of 3, or 2 of 1 of 1 of 3.
What are the wave attributes?
What is the “Type” wave attribute?
The pattern formed by a wave’s internal structure. For example, “impulse” for an impulse wave. You may specify multiple patterns for a wave. For example, if you’re interested in motive waves, you can specify that a wave be either “impulse” or “diagonal”.
What is the “Subtype” wave attribute?
While the “Type” attribute defines the pattern (impulse, flat, etc), “Subtype” allows the Wave Finder to represent additional pattern information beyond just the basic type.
For example, a “sideways” subtype is a pattern that moves predominantly sideways, as opposite to a “sharp” pattern.
What is the “Label” wave attribute?
The position of a wave in a larger pattern. These should be self-explanatory, because they’re mostly identical to classical Elliott wave labels. The one exception is triangles, which use lowercase a-b-c-d-e instead of uppercase. Doing so allows the expression of “the final wave of a pattern” which would require a difference between “c” (part of a triangle) and “C” (the final wave of a zigzag or flat).
You may specify multiple labels for a wave. For example, if you’re interested in motive waves in the final position of a structure, you can specify that a wave be either “5” or “C”.
What is the “Channel Adherence” wave attribute?
Channel adherence measures how closely a pattern conforms to a price channel, expressed as a score from 0% to 100%.
Impulses, zigzags and double zigzags all tend to form channels bounded by parallel lines, so adherence is most meaningful for these structures.
When channel adherence is available
A wave will have a non-zero adherence score only if one of the following is true:
- Zigzag: Wave C exists and either has a target estimate or is fully complete.
- Double zigzag: Wave Y exists and either has a target estimate or is fully complete.
- Impulse: Wave 4 exists and either has a target estimate or is fully complete.
Otherwise
In all other cases, channel adherence is 0%, because EWAVES does not yet have enough information to estimate a price channel.
What is the “Break” wave attribute?
“Breaks” are levels that you need the Wave to hit before you want it to show up in the Wave Finder.
This is useful because some types of Elliott Wave setups require a specific price level to be broken before taking action. For example, before taking action against a completed zigzag correction (in anticipation of an impulse in the opposite direction), it may be prudent to wait for additional signs that the zigzag is complete.
An aggressive person may simply take a position without requiring any particular level to be broken, while a conservative person may require Wave B of the zigzag be broken before taking a position. An in-between person may simply want to see the baseline of the zigzag be broken.
Baseline breaks behave differently from other kinds of breaks, because the break must hold. In other words, price cannot break the baseline and then subsequently unbreak it.
What is the “Limit” wave attribute?
“Limits” are the opposite of “Breaks”. While “breaks” are levels you want the wave to reach, “limits” define the levels at which the wave has already moved too far to still be considered a viable setup.
For example, an impulse wave that breaks out of the preceding zigzag’s price channel might be a good candidate to take a look at, but some people may regard it as being “too late” if that impulse has already exceeded the entire price territory of the preceding zigzag.
What is the “Elliotticity” wave attribute?
This is a percentage measure (0% to 100%) describing how strongly a wave’s internal structure, plus a certain amount of its context, conforms to the Elliott wave model. For details see the earlier FAQ question “What is Elliotticity?”. Elliotticity is helpful in identifying high quality waves.
What is the “Linearity” wave attribute?
This is a percentage measure (0% to 100%) describing how line-like a wave is. 100% would be a perfectly straight line, whereas 0% would entail a sideways, 2-dimensional structure. A triangle would be expected to have low linearity, while an impulse wave would be expected to have high linearity. This measure is akin to the concept of fractal dimension. Linearity is helpful in identifying strongly trending waves.
What is the “Completeness” wave attribute?
This is a percentage measure (0% to 100%) describing an estimate of how close a wave is to completion, in terms of both price and time. For example, an impulse wave that is currently in its 5th wave is likely more complete than an impulse wave that is currently in its 2nd wave.
Completeness is useful to anticipate turning points, such as starting waves (those that are 0 to 5% complete), or ending waves (those that are 95% to 100% complete).
What are the “Duration” wave attributes?
Duration is how long a wave has taken to unfold thus far, in days; expected duration is how long a wave is estimated to last; remaining duration is how much time is estimated to be left before a wave completes.
The expected duration is the primary way to measure the overall size of a wave, regardless of if it’s a brand-new wave that is only one-day into its development, or if it’s a more mature wave. If you wish to “anticipate all advances or declines of a particular total duration”, then expected duration is a great way to do that.
The reason that expected duration is considered the “primary” method of identifying wave size is simply because it is invariant to the underlying volatility of the asset. Magnitude, in contrast, depends on a market’s volatility.
Duration (that is, duration thus far) is helpful to identify existing trends. For example, you may wish to find waves with a duration of around 100 days, and then sort those waves by their slopes. Momentum considerations can then be combined with wave structure considerations.
What are the “Magnitude” wave attributes?
Magnitude measures the percentage move of a wave from start to its last recorded price; expected magnitude is the estimated percentage move from start to end; remaining magnitude is the estimated percentage move left from the last recorded price to the end of the wave.
Magnitude is sometimes useful for sorting. For example, we may be looking at a particular Elliott wave setup using the Wave Finder, and we wish to sort the waves by their remaining magnitude. (Note that you can easily sort in reverse order to see declining waves.)
Magnitude is not the same concept as the height of a wave (the distance from its lowest to its highest price). A sideways pattern, such as a triangle or flat, may have a large height but a small magnitude. If you’re interested in searching for triangles or flats, duration is a better measure of size than magnitude is.
Magnitude is asymmetric because a 100% increase is the same log distance as a 50% decrease. We could have made it symmetric by changing the units to log-returns, but (1) that is less intuitive for most people and (2) the natural asymmetry of percentage changes is often desirable when considering stocks and ETFs.
What are the “Slope” wave attributes?
The slope of a wave measures the %-per-year from the start of the wave to the current price; expected slope is the estimated slope from the start of the wave to its end; remaining slope is the estimated slope from the current price to the end.
Slope is a useful mechanism for finding high-momentum trends. However, one caveat with slope is that short-term waves are much steeper than long-term waves. (This is the case because the component waves of a parent wave are each partially retraced, so they must be collectively steeper than the parent wave.) For a slope comparison to be meaningful, compare waves within the same asset class and ensure that the waves are of similar duration.
Like magnitude, slope is asymmetric, since a 100% increase-per-year is the same log size as a 50% decrease-per-year.
What if I need a new wave attribute?
Please contact us with a detailed description of the wave attribute that you care about, and we’ll consider it for addition into the Wave Finder.
What are some example Wave Finder queries?
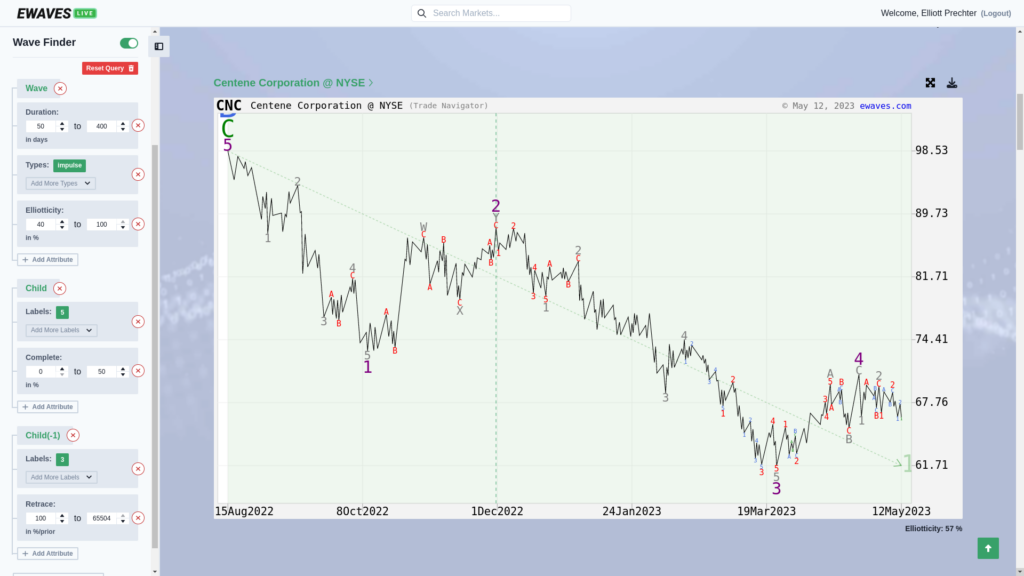
Example Query #1 (click image(s) to view in new fullscreen tab)
This example query looks for a newly started impulsive 3rd, 5th or C wave of an impulse or zigzag.
It does so by finding unfolding impulse waves, with label 3, 5 or C, that have retraces 50% or less of their prior waves (i.e. wave 3 has not yet surpassed 50% of wave 2 yet). The parent wave is either an impulse or a zigzag. The prior wave, which must be a corrective 2, 4 or B, must have a duration between 28 and 400 days. Both the wave and the parent wave must have an elliotticity of 50% or greater.
Note that restricting the duration of wave 2 is there because you have to restrict the duration of at least one wave or else you get waves which are far too small or large.
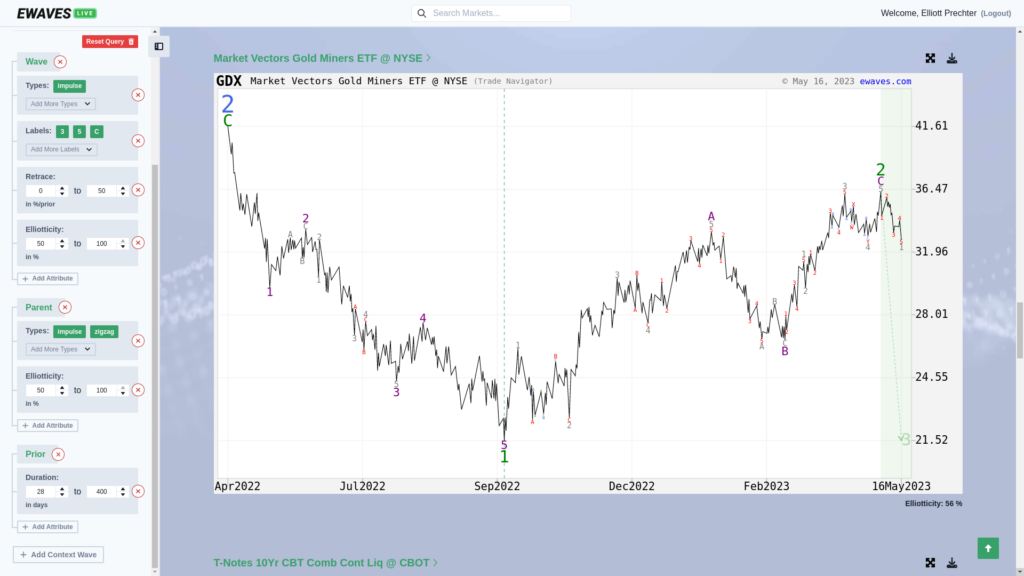
Example Query #2 (click image(s) to view in new fullscreen tab)
This example query looks for a 5th wave in progress that is showing short-term strength. Therefore, the larger impulse is nearly done.
It does so by finding unfolding impulse waves with a duration between 50 and 400 days, and a minimum elliotticity of 40%. The unfolding child wave is a 5th wave that is less than 50% complete. The unfolding grandchild wave is a 3rd wave which retraced at least 100% of its preceding wave 2.
You can optionally add a linearity requirement to the wave (say, 50% to 100%) to search for particularly strong impulse waves.
Support
I just signed up, how do I get started?
Getting Started with EWAVES Live
Welcome to EWAVES Live! Here’s a quick guide to help you get started:
- Login Information:
- Access EWAVES Live by visiting ewaves.com and clicking the “Login” button, or jump directly via live.ewaves.com.
- Troubleshooting:
- If you experience any login issues, please contact us.
- User Tutorial:
- For a detailed walkthrough, you can watch our user tutorial, as well as the “Live Trading with EWAVES” series, at ewaves.com/videos.
- For more questions, review our FAQ at ewaves.com/faq.
We’re excited to have you on board and look forward to helping you make the most of EWAVES Live!
I’m getting an error when trying to access EWAVES Live, what should I do?
EWAVES Live may not work on VPNs or some work/school networks that route traffic through secure gateways.
Please try accessing the site from a home internet connection or mobile hotspot without a VPN. If it works there, contact your IT department and ask them to provide direct internet access (no VPN, proxy, or SSL inspection) for live.ewaves.com and Google services.
If you continue to experience issues, please contact us and include any screenshots or error messages.
How do I change my password?
Go to the EWAVES Live portal and log out if you are currently signed in. Once you are back on the login screen, select “Reset Password” and follow the instructions to create a new password.
How do I get customer support for EWAVES Live?
Please contact us with questions or suggestions. Institutional clients may contact us via phone (number provided during sign up).
Support is provided during our normal business hours and to the best of our ability, at our convenience. Qualitative Analytics assumes no liability for any customer’s investment results, regardless of the cause.
Where can I read the EWAVES Live Terms of Service?
See our Terms of Service page.
About
Who developed the EWAVES engine?
The engine is developed by Elliott Prechter.
Bio for Elliott A. Prechter, President of Qualitative Analytics
Elliott has been passionate about technology since childhood. In high school, he built a 3D graphics engine that placed nationally in the Siemens Westinghouse Science & Technology competition. He attended MIT in 2002 and joined Microsoft after graduation. During the 2008 crash, he successfully shorted the banks, and in 2010, he recommended Bitcoin at 6 cents as a guest author in The Elliott Wave Theorist.
In 2011, Elliott’s life took an unexpected turn. Chronic pain forced him to leave his role as a hedge fund CTO. Unable to return to big tech, he moved home and developed symbolic AI software for Elliott wave analysis. That software became EWAVES, which was later spun off into Qualitative Analytics, where he now serves as President.