
News
-
Interest Rates have Soared. What’s Next?
-
EWAVES Anticipated the Surge in Interest Rates
With long-term interest rates back in the headlines, it’s worth revisiting what EWAVES was saying before the latest surge began.
The story actually starts before EWAVES turned bearish on Treasury bonds.
First, EWAVES was bullish
The last time EWAVES was bullish on bonds was June 3, 2024. The Elliott wave pattern indicated that bonds were beginning a significant upward move. EWAVES expected that rally to continue and exceed the preceding high.
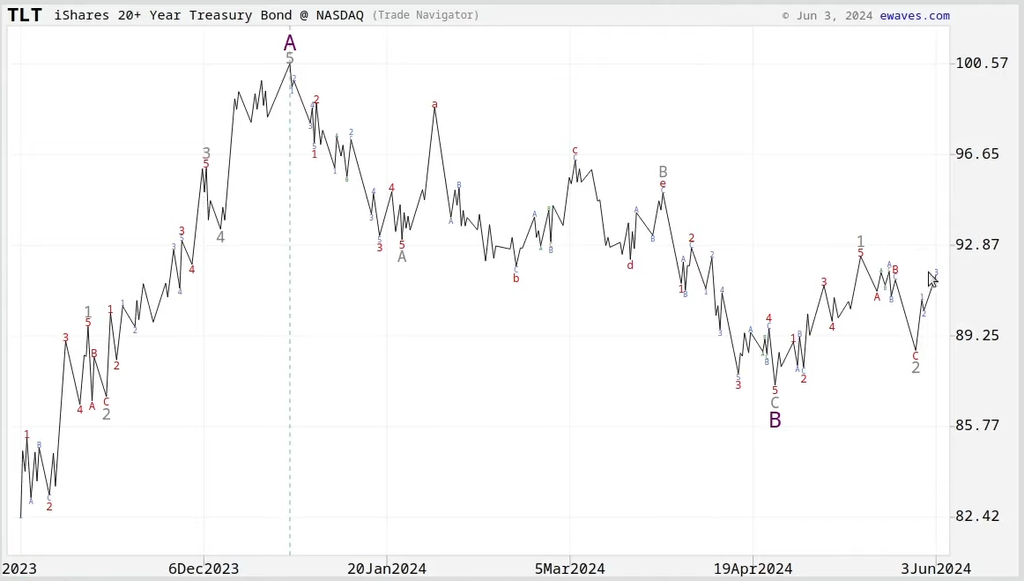
But EWAVES knew—in advance—that the rally would mark the end of a large correction, not the beginning of a new bull market in bonds.
Then, EWAVES turned bearish
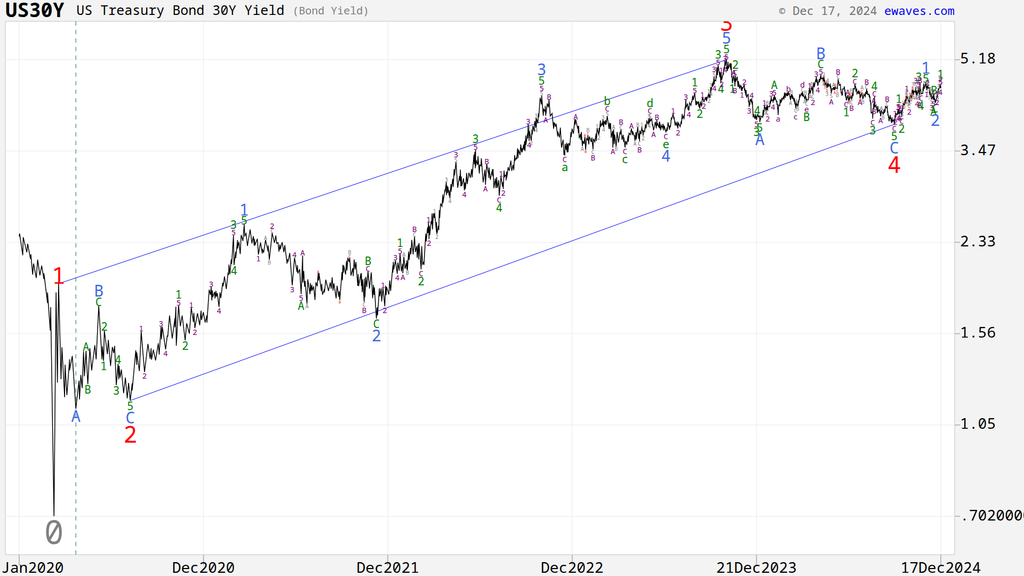
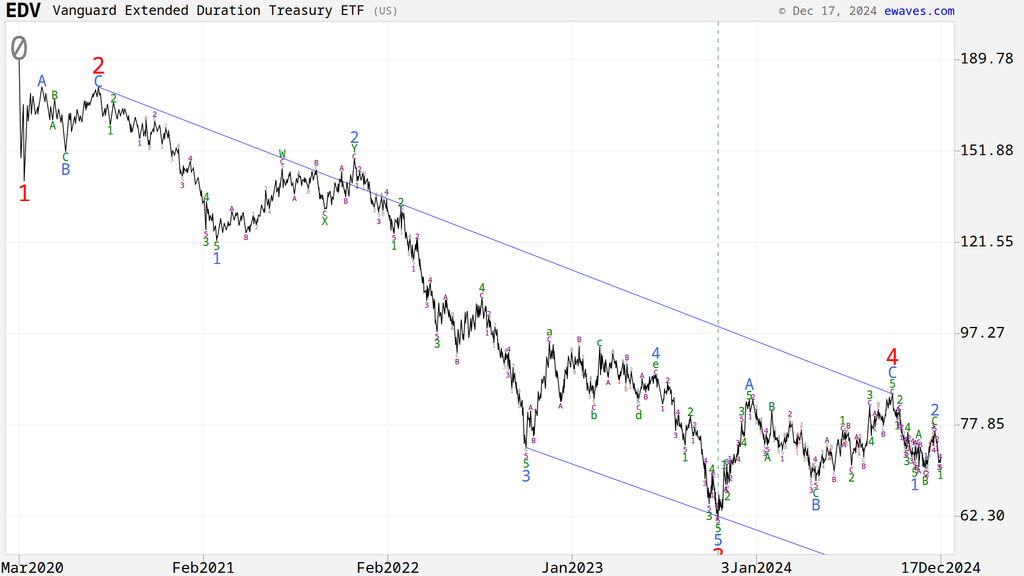
The following two EWAVES charts were published on December 17, 2024. One shows the 30-Year Treasury yield, and the other shows EDV, an ETF holding zero-coupon Treasuries.
Both charts indicated that the counter-trend bond rally had run its course, and that a fifth wave toward higher yields, and lower bond prices, had begun.
See the analysis behind the forecast
In the video below, Elliott Prechter explains how EWAVES arrived at that outlook, including an Elliott wave clue that helped identify the earlier bond rally as corrective, and an interesting parallel between the bond bear market and the stock market crash of 2008.
Watch beginning at 32:27.
What about rates now?
Will long-term rates keep rising, or could a major bond rally eventually unfold?
EWAVES Live subscribers can see our current outlook. The US package includes U.S. bonds and interest rates.
-
PLTK Breaks Down from a Classic Pattern
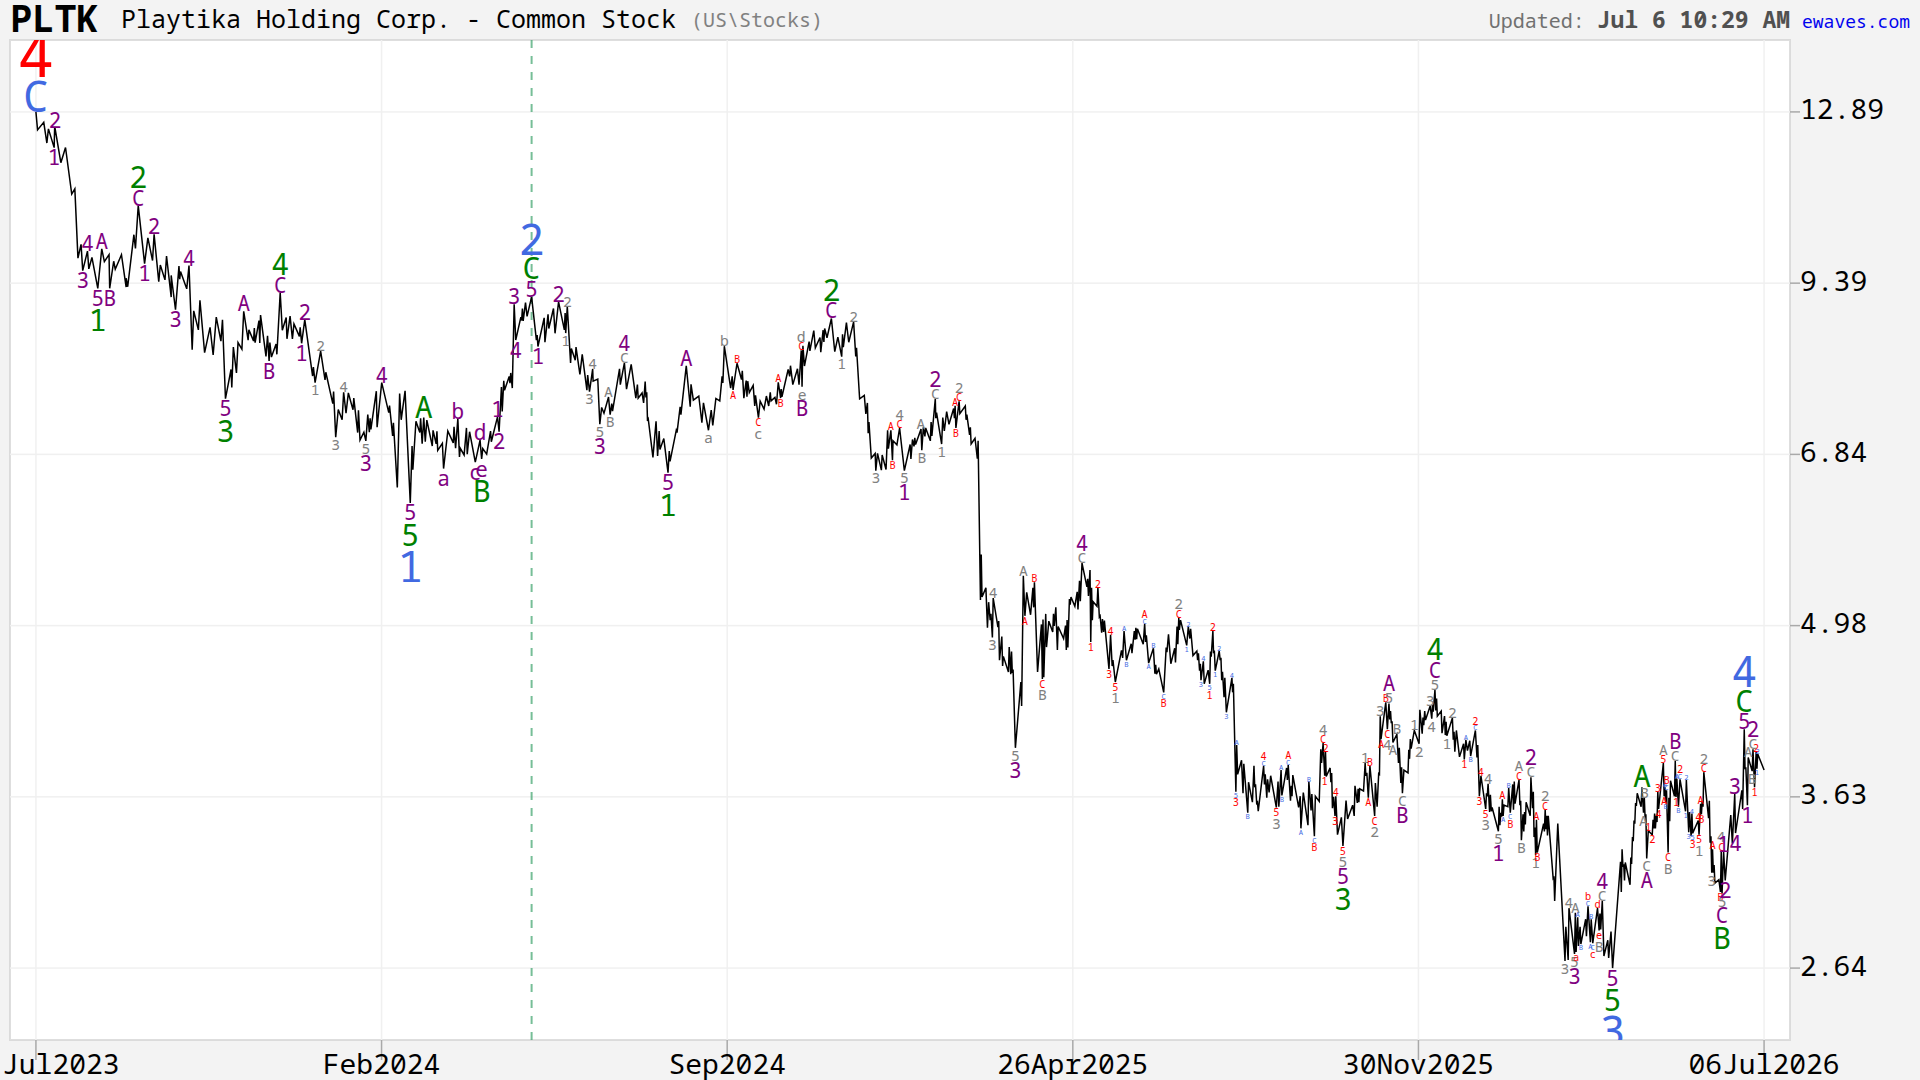
On August 6, the EWAVES Wave Finder identified Playtika Holding Corp. (PLTK) in its “Breakout from Correction” scan. Here’s the wave count that Wave Finder flagged:
What is “Breakout from Correction”?
“Breakout from Correction” is a build-in Wave Finder setup looks for a fresh impulse wave that has just broken the trend channel of the correction before it — but hasn’t yet cleared that correction’s price range and still has room to move.Here’s why PLTK made the list:
Pattern:
Blue wave 4 had traced out a classic zigzag pattern, labeled green A-B-C, off its April low. On August 6, price broke down out of the corrective channel — the early stages of blue wave 5. At 3.17, with a minimum target below 2.64 and still inside wave 4’s range, there was still room to participate in the move.Right Look:
Take a minute to study the clear subdivisions on the chart above: the five wave declines within blue waves 1 and 3 – AND the smaller five-wave declines in their purple subwaves. Those are just some of the elements that contribute to the “Elliotticity” score, which measures how closely a market’s structure matches the idealized Elliott wave model. PLTK scored 92%.Wave Context:
One of the best aspects of the Wave principle in general is the perspective and context it can provide. In this case, four completed waves gave EWAVES a ton of information to project the fifth wave with — channeling, proportion, and dozens of other factors. PLTK has since fallen from 3.17 to 2.16 — a 32% decline as of August 18.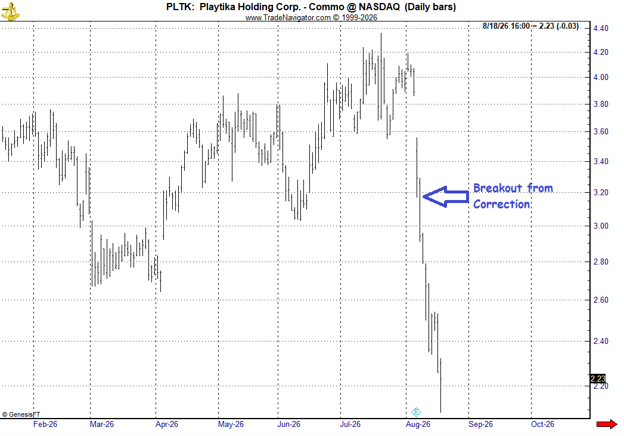
-
Elliott Prechter on Markus Koch Wall Street: Elliott Waves, AI, and the Psychology of Markets
In Elliott Prechter’s May 30, 2026 interview on Markus Koch Wall Street, he explains why markets are not reactions to news, interest rates, earnings, or economic data, but expressions of collective psychology unfolding in recognizable Elliott wave patterns.
The conversation traces the roots of Elliott wave theory, from Ralph Nelson Elliott’s discovery of recurring price and time patterns to Robert Prechter’s role in reviving the theory on Wall Street.
Elliott then discusses how EWAVES is using symbolic AI to make Elliott wave pattern recognition scalable across global markets. He also explains why markets remain fundamentally human even in the age of AI, as prices still reflect collective swings in optimism and pessimism.
Interview conducted by Markus Koch, with Lars von Thienen of the Foundation for the Study of Cycles and Ralf Fayad of Technical Analysis 360WallStreet.de.
Want to test out the EWAVES engine for yourself? Get started with EWAVES Live today.
-
The Elliott Wave Setup That Checkmates the Market | Prechter at FSC 2026
In Elliott Prechter’s May 30, 2026 presentation for the Foundation for the Study of Cycles, he begins with the basics of Elliott waves, then explores how Elliott wave analysis can help identify a market setup so powerful that it is the closest thing to checkmating the market.
Then he shows how to use Wave Finder, an EWAVES tool that scans thousands of markets for specific Elliott Wave setups, to automatically find this setup and others like it as they unfold across global markets.
You’ll see how impulses, zigzags, flats, and triangles work in real markets, including gold, Google, and the S&P 500.
Elliott also explains how EWAVES differs critically from quantitative market models: It is a stationary, stable market model that applies across all of history, unlike the quantitative models that burn out when the macro regime changes.
Want to test out the EWAVES engine for yourself? Get started with EWAVES Live today.