

We completed EWAVES (Elliott Wave Analysis and Validation Expert System ) 3.1 in early 2021. With that version, we reached a higher level of quality than ever before achieved in software wave analysis. Our algorithm considers and balances more nuanced technical aspects of the Elliott Wave Principle than a single person could hold in his or her head. Additionally, it saves a lot of time compared to labeling every market by hand, and it reliably leads to objective results because the software has no biases.
The engine is highly tuned to be fast, allowing us to perform analysis on all markets for which sufficient data are available. We are currently automating charts on about a thousand markets in the categories of Forex, Futures, Commodities, Cryptos and individual Stocks/ETFs trading in the United States, Britain and Germany.
Coincident with completing version 3.1, we finished construction of EWAVES Live, a web portal for accessing EWAVES. The primary uses of the web portal are viewing charts and ranking assets by elliotticity, which is the extent to which each market adheres to the Elliott wave model. Elliotticity is expressed on a percentage scale of 0% to 100%. The clearer a market’s patterns, the higher its elliotticity. Focusing on high-elliotticity markets leads to easier and more confident forecasts.
We check the EWAVES Live market rankings every day, because elliotticity is dynamic. A market that barely adheres to the model today may become a nearly ideal expression of it tomorrow.
Elliotticity is time frame dependent. A market may have a clear short term picture but a fuzzy long term picture, or vice versa. Currently, we default to ranking assets by short term elliotticity, so we can laser focus on identifying markets that have traced out clear Elliott waves over the past 6 to 24 months. We are, however, in the process of implementing a custom time frame selection feature for elliotticity rankings.
EWAVES on Bitcoin
EWAVES is an exciting financial technology, so it shouldn’t come as a surprise that we have been applying it to another exciting financial technology: cryptocurrency.
Of all cryptocurrencies, bitcoin usually has the clearest patterns, regardless of timeframe. This makes sense because it is so heavily traded. Bitcoin comprises almost half of the entire crypto sector (46.5% to be exact, according to https://coinmarketcap.com/), and high-volume and high-market-capitalization assets adhere to the Elliott wave model better than thinly traded issues. Patterns result from herding, and herding occurs more reliably among the largest crowds. Additionally, bitcoin has the longest price history. Elliott waves are contextual, so the more context that’s available, the better.
Bitcoin recently caught our eye when it hit a 3-month elliotticity of 98% on January 27, 2022, as shown in Figure 1. It had just completed 5 waves down, from November through January, so it was due for a rebound. We immediately sent out an alert to Flash subscribers that included the bitcoin chart.
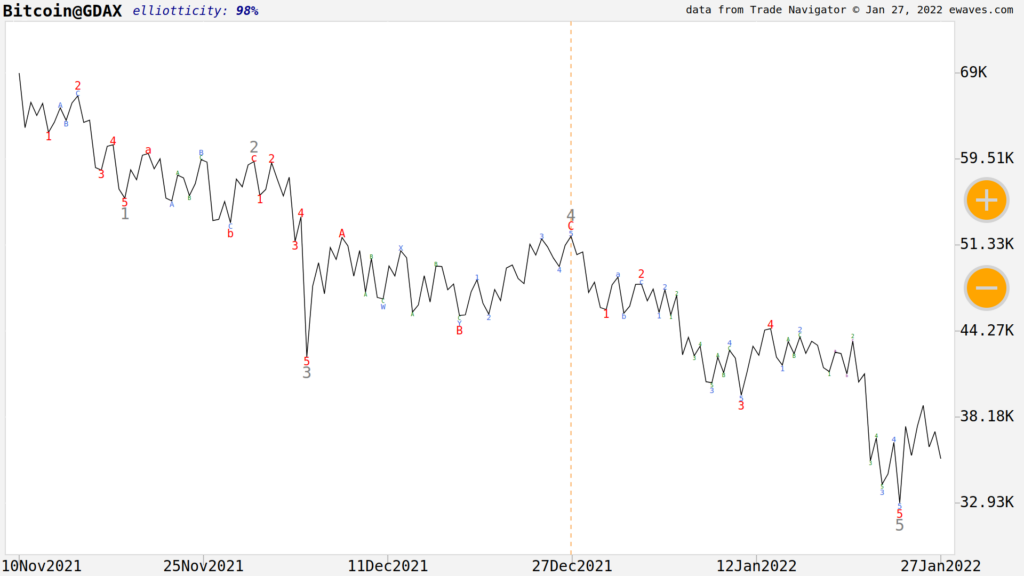
Figure 1
The reason for our excitement was the expected size of the bullish move. As any experienced Elliott wave practitioner will tell you from looking at Figure 1, the expected retracement should gravitate quickly towards at least the area of wave 4 at around $50K, and ideally to wave 4 of 3 (which in this case is also around $50K).
On the chart, bitcoin’s five-wave decline ends with an extended fifth wave. Therefore, the retracement distance from wave 5’s low to wave 4’s high is greater than usual. To get back to $50K from the $30K low of wave 5, bitcoin would need to move about 67% to the upside.

Figure 1 might look a bit odd if you are used to bar or candlestick charts. Internally, EWAVES’ data module approximates the time location of each bar’s high and low, and interpolates between them to provide contiguous price action, which is required by the analysis module. The charts are faithful to the internal representation, which gives them a wireframe-like quality when viewed on a short-term basis.Also, unlike the trading-day bar charts that most financial programs use to drive their indicators, EWAVES uses calendar time for all its data points. This means that weekends and holidays are not ignored. Prices are approximated linearly over these gaps.
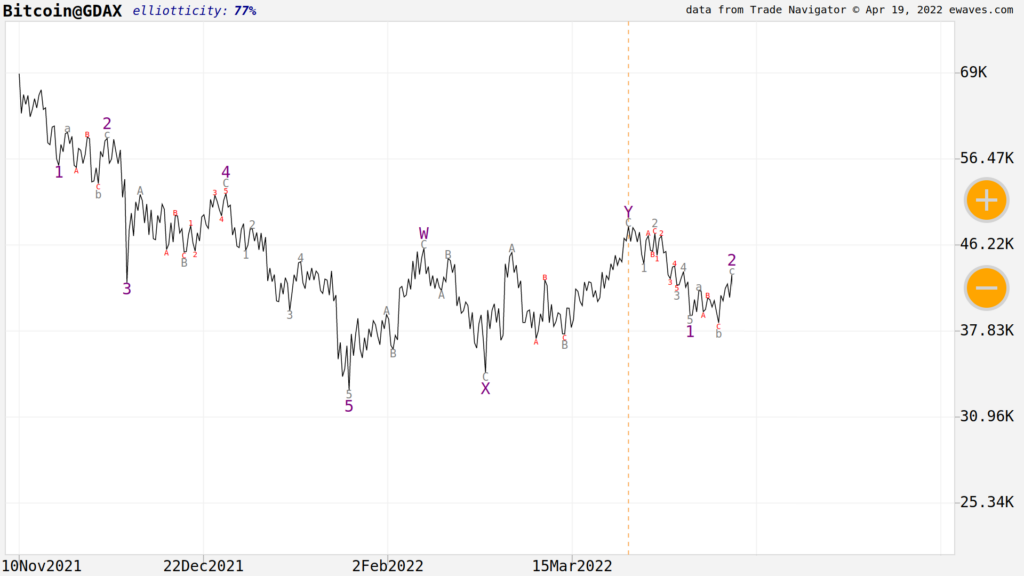
Figure 2
Now let’s fast-forward to April 19, 2022. As shown in Figure 2, bitcoin moved higher in typical corrective fashion, retracing part of the downward impulse wave. The correction took the form of a double zigzag pattern, labeled W-X-Y. The subwaves within the double zigzag are clear. Wave Y subdivides into a single zigzag with a triangle in the wave B position, which is followed by five waves up for wave C of Y.
The retracement made it all the way back to $48K—almost exactly to the peak of wave 4, as expected. This amounts to about a 50% move up from the January low.
As in Figure 1, Figure 2 contains a compelling wave setup, yielding a second successive opportunity. This time, it’s for the bears. The rightmost side of Figure 2 shows labels for waves 1 and 2, indicating that wave 3 to the downside is imminent.
Third waves are the strongest moves in an impulse, so we can estimate from Figure 2 that the next downward swing should eclipse the advance from January, which was only a corrective move. The strength of this setup paints an even more compelling picture than does Figure 1. So much so, in fact, that we published the full zoomable/dynamic version of the EWAVES Live chart shown in Figure 2 on the front page of ewaves.com on April 19, 2022, the day the setup occurred (it is still posted there).
The figures we’re showing in this newsletter are static images showing only a slice of time. On EWAVES Live, however, charts are dynamic. They each consist of a contiguous Elliott wave count spanning the entire dataset, forming a single fractal covering all timescales at once. The chart is zoomable, using the (+) and (-) buttons, from the big picture all the way down to the latest near term price movements.

Figure 3
Figure 3 shows what happened next. The market swiftly fell below $25K, in what is undeniably third wave action in both price and time. As expected, the decline from March through May on log scale was much larger than the advance from January through March, in fact about twice as big.
One issue that comes up when comparing the January-March advance with the March-May decline is that, in percentage terms, they both are about 50%. How can their percentage moves be nearly equal when the decline is clearly so much larger than the advance?
Percentages depend on your orientation. Measuring a market move from top to bottom gives different results from those you get when measuring from bottom to top. A market that falls 50% must rise 100% just to get back to even. This fact illustrates how the natural math of markets works against the bears: It is far less profitable to short a market that falls than it is to buy a market that then rises by that exact same amount. To compare apples to apples, you would need to measure the decline from bottom to top as well. From that point of view, the decline is a 100% move, which makes more sense and is compatible with what we see on the log chart.
The directional difference is an issue only when buying or selling assets in a cash market. The use of derivative contacts makes this point moot. For example, with futures, points are points, regardless of market direction.
The elliotticity values shown in our charts correspond to the picture that you see. This means that they will vary depending on the zoom level of the chart—different zoom level, different picture. Since the elliotticity used for ranking assets is dependent on a separate time frame selection in the EWAVES Live interface, it can differ from the chart’s cited elliotticity after zooming in (+) or out (-).
Amazingly, Figure 3 contains yet another bearish setup, providing an opportunity in bitcoin for the third time in a row. Last week, we issued a corresponding recommendation to Flash subscribers.
Figure 4 shows bitcoin’s price action through this morning. By hitting a low of $22K, it has taken out the end of wave 3, thereby meeting the minimum expected move for wave 5.
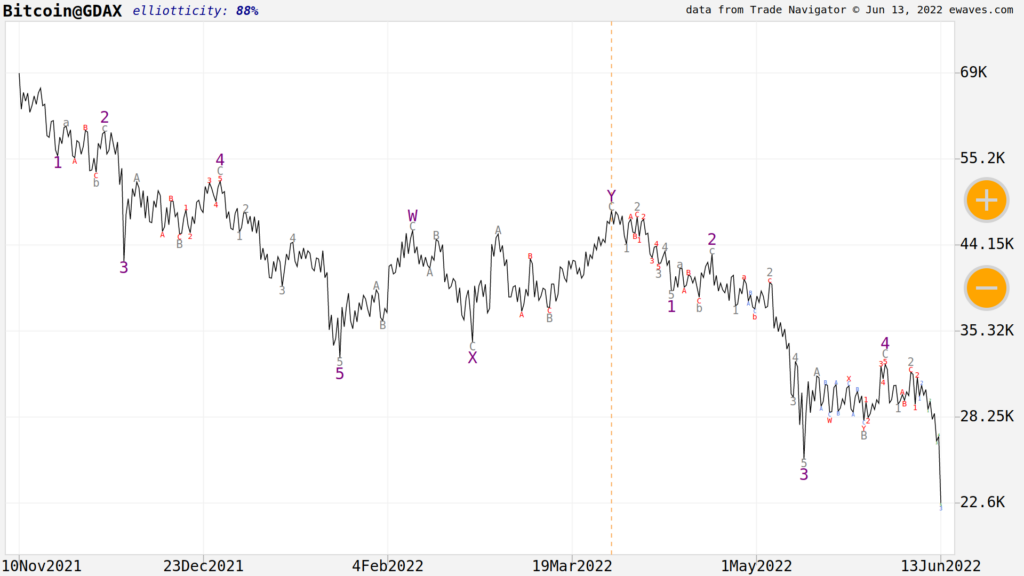
Figure 4
Legendary Volatility
Bitcoin’s recent short-term price moves have followed textbook Elliott wave forms. It is rare for a market to unfold with three clear Elliott-wave setups in back-to-back fashion as bitcoin has. Watching the wave count evolve each day on EWAVES Live has been a real treat.
Each time, the moves have been significant. As we have just seen, it is not uncommon for the coin to have sudden moves of as much as 50% or more. Consider further that bitcoin is the ultimate blue chip cryptocurrency. This means that other cryptocurrencies, or alt coins, are significantly more volatile.
To drive this point home, while currently bitcoin is down by roughly two thirds since its peak in November 2021, the even more significant selloff has been in alt coins. Many have fallen 90% or more. Some news outlets have referred to the decline as an alt coin massacre. Money reports that more than half of crypto investors are now in the red, which is astonishing since crypto markets have been heading up for nearly a decade. One alt-coin, Luna, crashed to $0, wiping out investors completely.
But wait a second. Isn’t volatility a market neutral concept? A so-called “massacre” is only a massacre for the trader that is on the wrong side of the market. A bullish period is a massacre for the trader who is short.
So, it’s not volatility that hurt crypto investors recently. It’s that they were betting on the wrong direction. Without a reliable model to guide them, they were unconsciously at the mercy of the crowd. This means they have been gambling, not trading.
Would Elliott wave analysis have allowed us to beat the crowd? Let’s test this hypothesis using EWAVES on the Luna cryptocurrency, since Luna experienced the heaviest losses in all cryptoland. The coin’s price history is available from Yahoo Finance (download it here), so we can load it into EWAVES.
Obviously, loading all the data points, including those pertaining to the crash, is not particularly informative; it just confirms what we already know. We need to time-travel backwards to see what EWAVES was thinking at important times. This is possible by simply clipping the data so that EWAVES sees the data only up to a particular date.
With a human analyst, we cannot do this kind of time traveling test, because a human knows the future and thus would be performing analysis under hindsight bias. EWAVES’ algorithm, in contrast, has no hindsight bias because it operates in a knowledge vacuum. It has no preconceived notion that the market is going to experience a massive crash. It simply does wave analysis on the data segment provided.
You may further rest assured that Luna is entirely out of sample. When we built our database of iconic counts to train EWAVES, Luna did not even exist. EWAVES has never seen this market before.
Figure 5 shows the Luna dataset through August 15, 2021. This chart labels the move from $0.12 at the low to $22.33 at the wave 3 peak, a gain of 186 times.
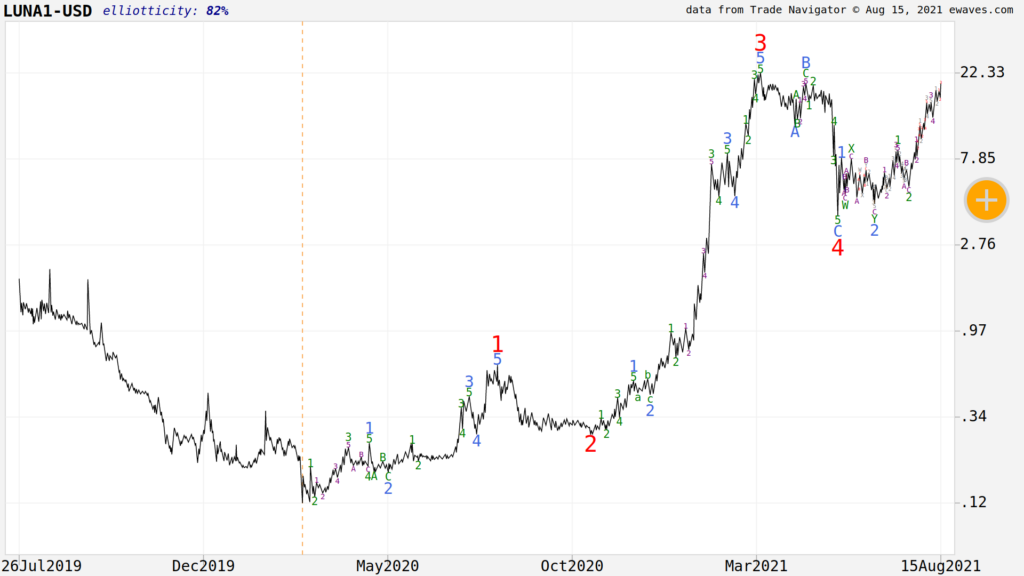
Figure 5
Luna’s final peak of $119.18 had not occurred, yet EWAVES knew more upside lay ahead. Figure 5 shows that there was already a tremendous amount of information in place at that early date, regardless of when or where the exact peak was to occur.
Think about the effect EWAVES’ analysis would have on investors who had this information at that time. For those on the sidelines, Figure 5 makes it clear that wave 5 is already quite far along in its evolution. It is a big warning that while a trader may still be able to take advantage of further rise in this market, it is not a market for buy-and-hold, long term investment. Those already invested can choose either to continue riding the fifth wave until EWAVES registers a top, or they can choose a more conservative option, which would be to exit as soon as Luna makes a new high above wave 3 at $22.33. Either way, a stop at the $5.60 low of wave 2 of 2 of 5 would be a reasonable safety measure.
Now let’s move the data forward to January 31, 2022. This is the first time EWAVES put in a top for wave 5, marking the end of Luna’s bull market at $103.33.
Wait a moment though. As later action reveals, EWAVES called the top prematurely! The final top in Luna was about $20 higher, at $119.18.
Such events show that EWAVES is an analytical system, not a crystal ball. Figure 6 is labeled about as well as it is possible to do. Almost all the waves and sub-waves are there. Within wave 5, wave 3 is the longest wave, followed by wave 5, and finally wave 1. This is the most common expression of an impulse wave. Wave 3 subdivides into the same expression. Wave 4 forms a roughly 1:1 size relationship with wave 2, an important correspondence in wave analysis to maintain what we call the right look.
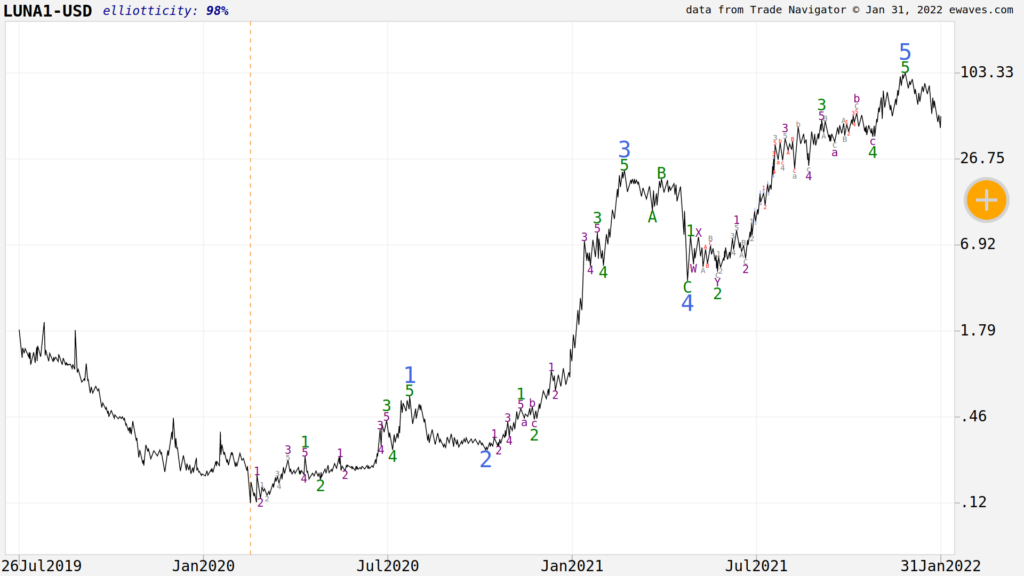
Figure 6
EWAVES’ charts always color the top degree red, the next blue, and so on, forming a color cycle. Since we just finished five waves up, there is now a new top-degree wave (not shown), shifting the color palette. This is not of any technical importance, because the degrees in EWAVES are only relative to each other and have no absolute meaning.
The only imperfect aspect of wave 5’s internals is the lack of clear impulsive subdivision within wave 5 of 5. But, EWAVES has seen this type of imperfect fifth wave before in a historical, iconic market: The French CAC contains a major impulse wave in the 1990s in which the final fifth wave lacked proper subdivision. EWAVES is prepared for these situations. It is programmed to do what any expert wave analyst would do when it cannot discern a sub-pattern: it defers to the larger context. In the larger context, it is clear that the best labeling is that wave 5 is complete at $103.33. Despite one unclear wave, the overall elliotticity of Figure 6 is 98%, which is about as good as it gets. If imperfections were too great, elliotticity would drop sufficiently to warn us about the lack of clarity.
Practically speaking, pining away for crystal balls is a waste of time. Let’s look at reality instead. For investors who bought in anywhere from the $0.12 low onward, getting out on EWAVES’ early $103.33 top signal would still have represented a gain, in fact a gain of over 860 times from the starting low. The alternative to getting out “too early” would be to lose the entire investment as Luna crashes to zero, which is what happened to many investors. Imperfection or disaster, take your choice.
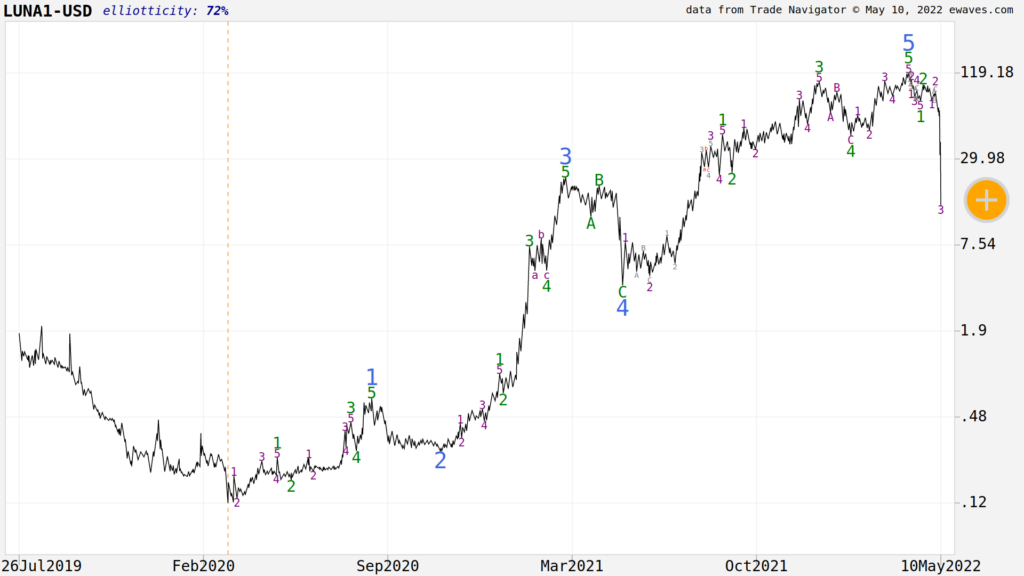
Figure 7
Figure 7 shows the beginning of the collapse, with data through May 10, 2022. By this point, EWAVES has updated its wave count to accommodate the slight new high on April 5. It is worth noting that the wave labeling into the final high had a lower elliotticity than the early top signal we received in Figure 6. Why? Because the final interpretation of wave 5 includes a fairly rare extended wave 1, a near overlap between waves 2 and 4, an unclear wave 3 of 3, and finally a wave 5 that is extended in the time dimension relative to the rest of the impulse. That is why Figure 7 has an elliotticity of just 72%, considerably lower than Figure 6’s 98% rating. EWAVES was correct that the earlier labeling was closer to the ideal than the later one, but reality chose the later one.
While it would of course have been better in this isolated instance if EWAVES did not give the signal early, one cannot adjust for it. Doing so would impede forecasting accuracy because reality generally defaults to the more ideal structures.
When you do analysis over and over on many markets, what matters is always going with the most likely wave count. Sometimes it means being early, and sometimes it means being late. That is the only way to optimize results overall.
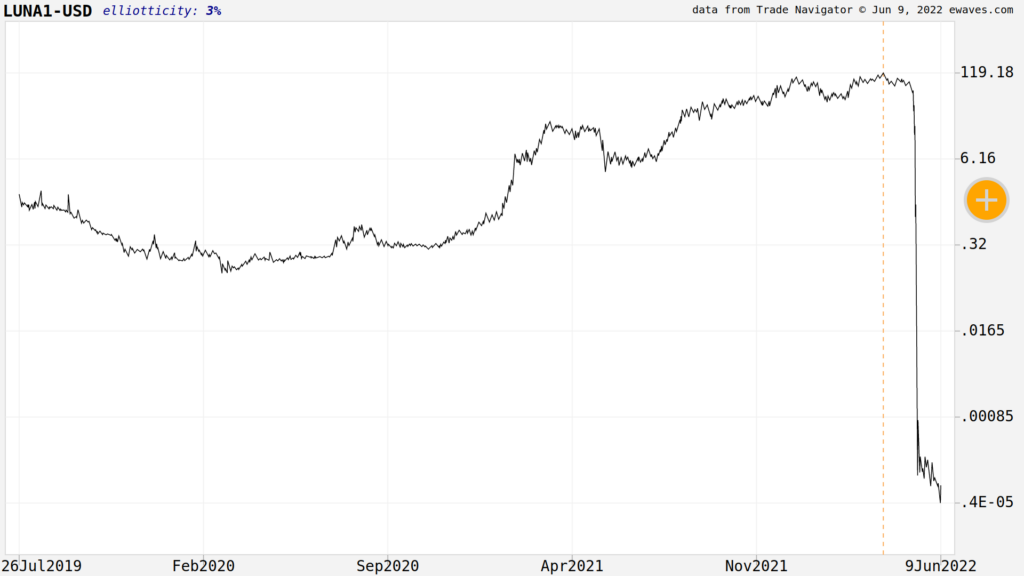
Figure 8
Finally, Figure 8 shows the final resolution of Luna, which crashed to zero, wiping out all investors. Do you care now that you got out early?
In Figure 8, EWAVES does not provide a wave count. With the March 2020 low taken out, it can no longer use that level as its origin for wave analysis. Instead, it must count starting at the April 5 high, though it found no useful wave structure from that point forward. We call this method of determining the analysis origin the seesaw method, since it always starts counting from the most extreme high or low, whichever comes first. As you move through time, the origin will shift as prices make new highs and lows.
Bubbles and crashes such as experienced in Luna are commonplace in the crypto sphere. But in the EWAVES world, we are not particularly interested in bubbles per se. Rather, we are interested in exploiting wave structure. To the extent that bubbles manifest good Elliott waves, they are something that can be traded. To the extent that they do not, they should be ignored.
The FOMO, or “fear of missing out,” and other intense emotions driving cryptos are probably the most powerful among financial markets that we have seen in a long time. It is easy to get swept up in new technology, especially if it is complex enough to generate a dazzling feeling of mystery. At a minimum, wave analysis provides a way to detach emotionally from the situation. As a result, one can derive a lot of benefit and avoid a lot of pain.
EWAVES: Present Use and Future Plans
Many of the analysts at Elliott Wave International use EWAVES to bolster their work.
To learn more about EWAVES, sign up for our free, open-access EWAVES newsletter here.
Institutions: We are working on a possible service for a select number of institutions. Any such service will be restricted and offered at institutional-level pricing. If you’re interested, contact us. We will inform you of our progress as it makes sense to do so.